Overview — updated with every price cycle
Real data for skins with a confirmed Steam price. None of this is a prediction; these are this week's facts. Compare two skins →
▼ Far below its high
Real liquidity and trading at least 30% below its all-time high — an objective fact, not a buy recommendation.










◈ Near its low and stable
Trading close to its all-time low (15% or less above it) and moving less than the market median — more conservative than the one above, without sharp jumps.







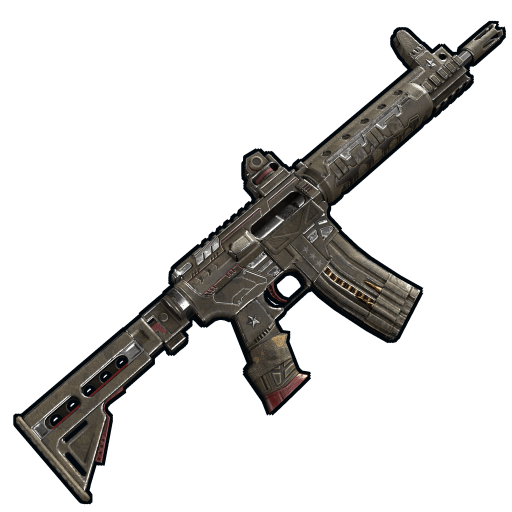


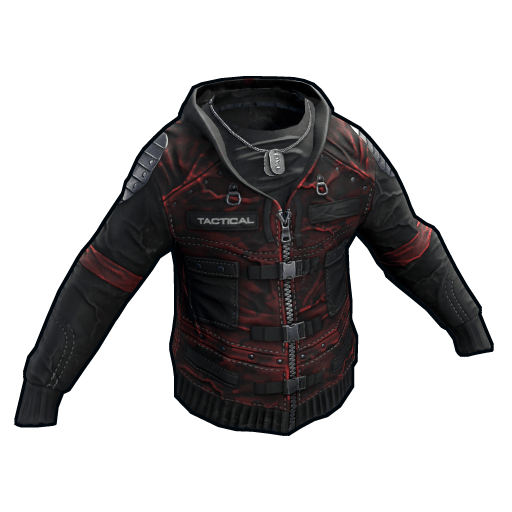
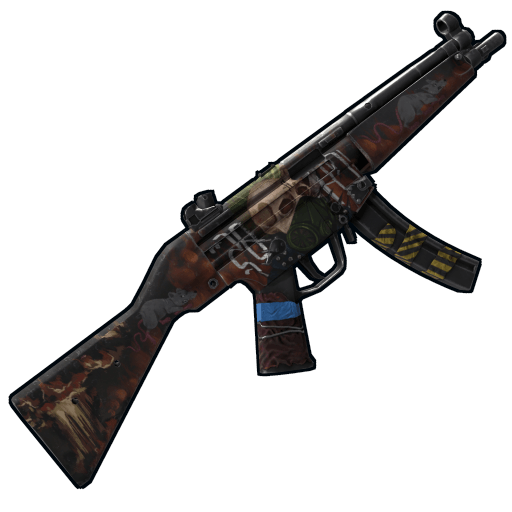






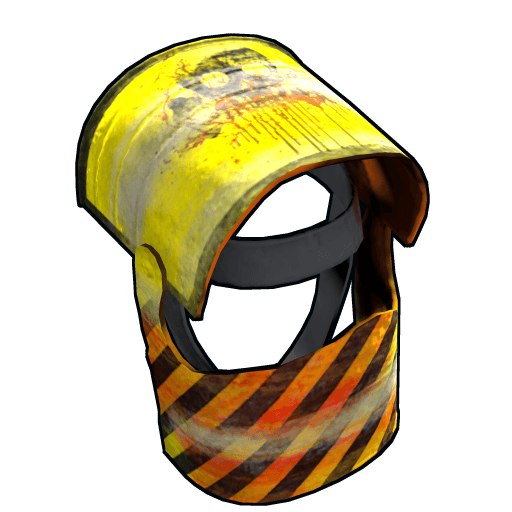
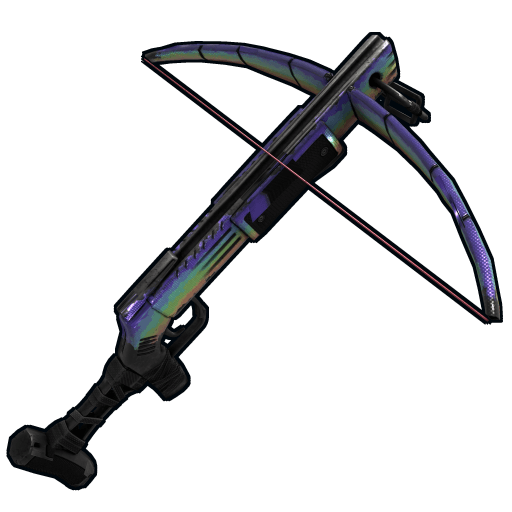
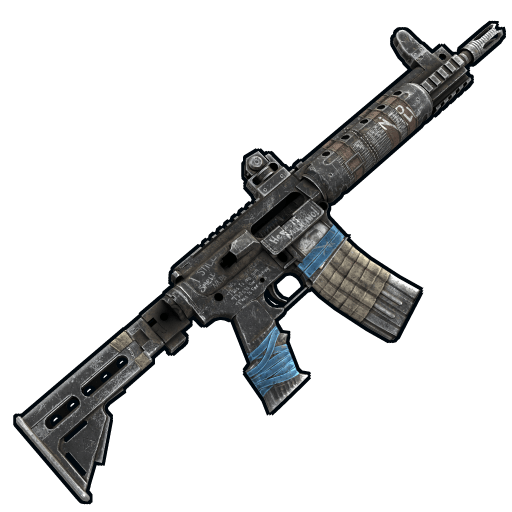
The ones that move the most, for better or worse — more risk, both ways.
Real volatility, calculated from our own history — it covers 5569 skins with reliable data (practically the whole catalogue with an active price). The higher, the more the price of this skin moves in either direction.


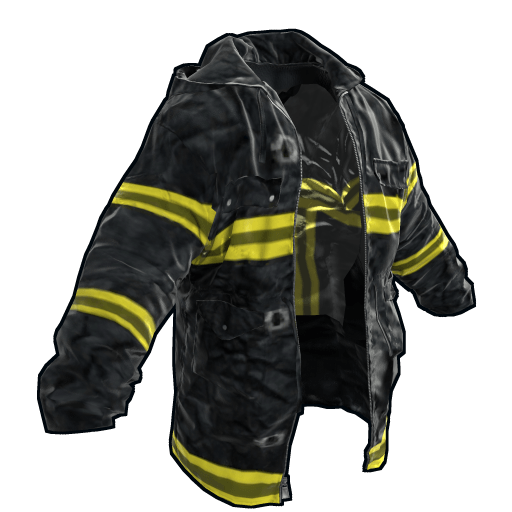



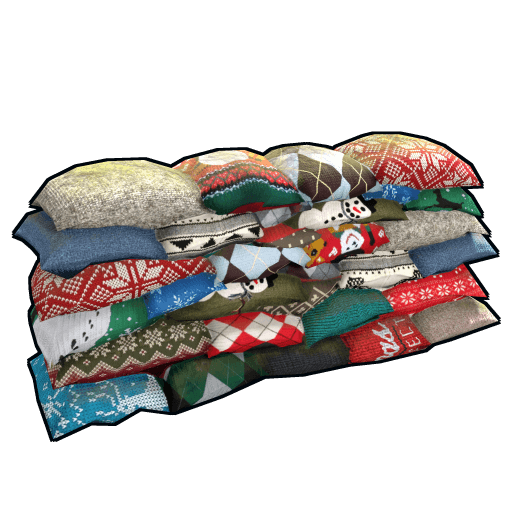


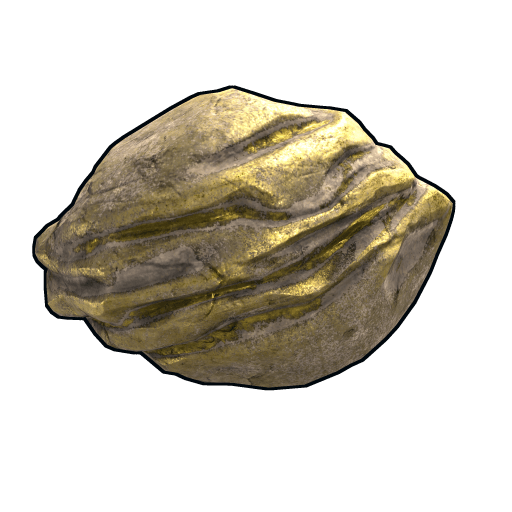


These skins can be bought cheaper on another third-party market than on Steam. No need to wait days to see it — it is a comparison of this moment, not a trend.
Only differences of 10% or more are shown, to avoid normal market noise.



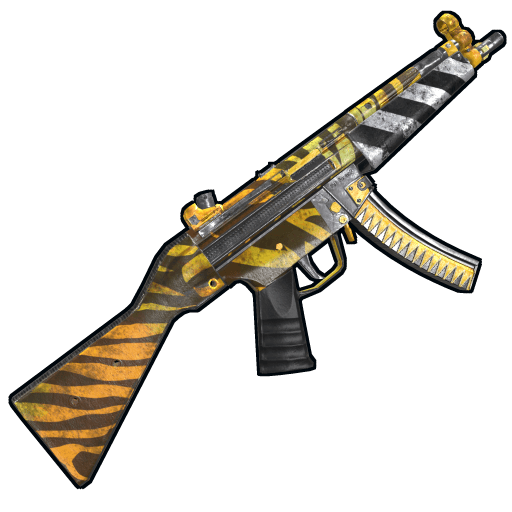
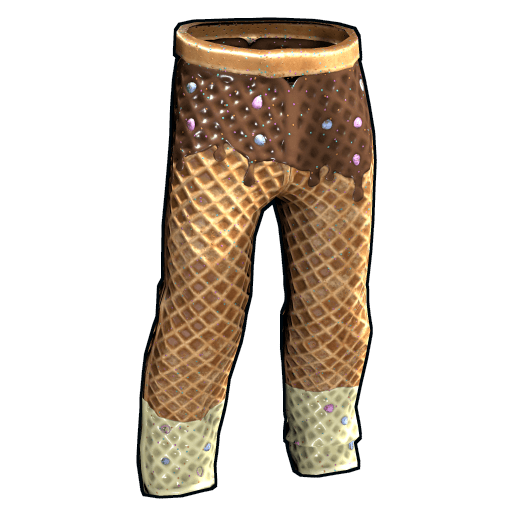





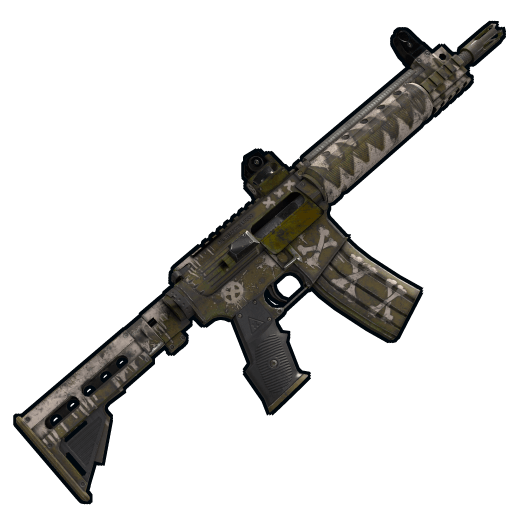
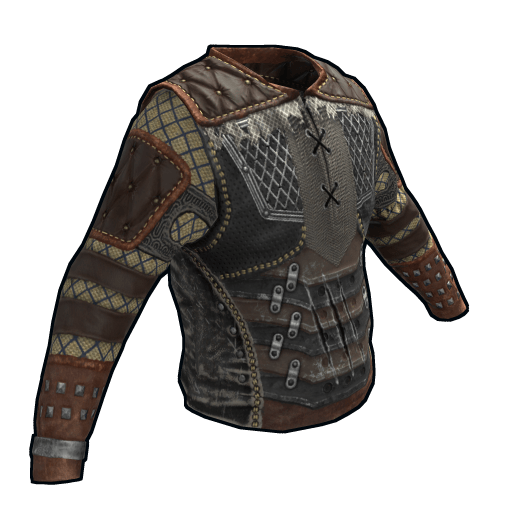







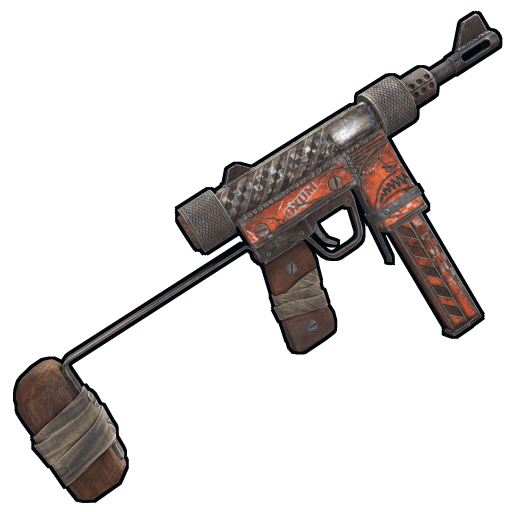


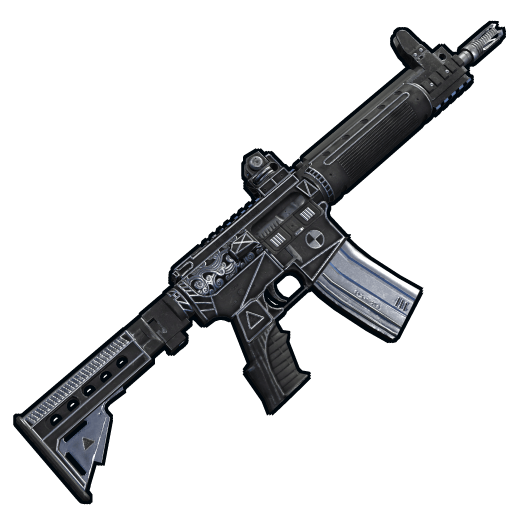



Rising (or falling) over 7, 30 and 90 days at once — a real sustained trend, not a one-day jump.
↗ Winning streak
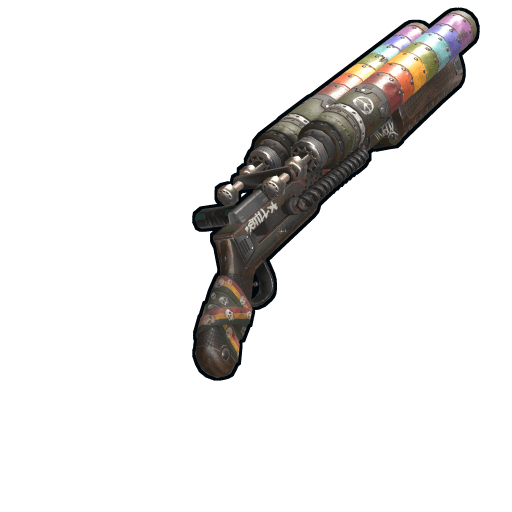





↘ Losing streak